During the pandemic, institutions were flush with deposits and short-term interest rates were at the zero lower bound. As a result, funds available for interbank lending were abundant and cheap. In response, many institutions purchased funding with long maturities, with terms of anywhere from 2 to 10 years or longer. By doing so, these institutions locked in low-cost, stable funding.
Now that interest rates are rising aggressively, institutions are less enthusiastic to purchase long-term funding and lock themselves in to a high rate. Uncertainty about the path of interest rates, mixed with trepidation about the state of the overall economy, seems to have banks favoring shorter-duration funding options, which allow them to remain flexible in response to new economic conditions.
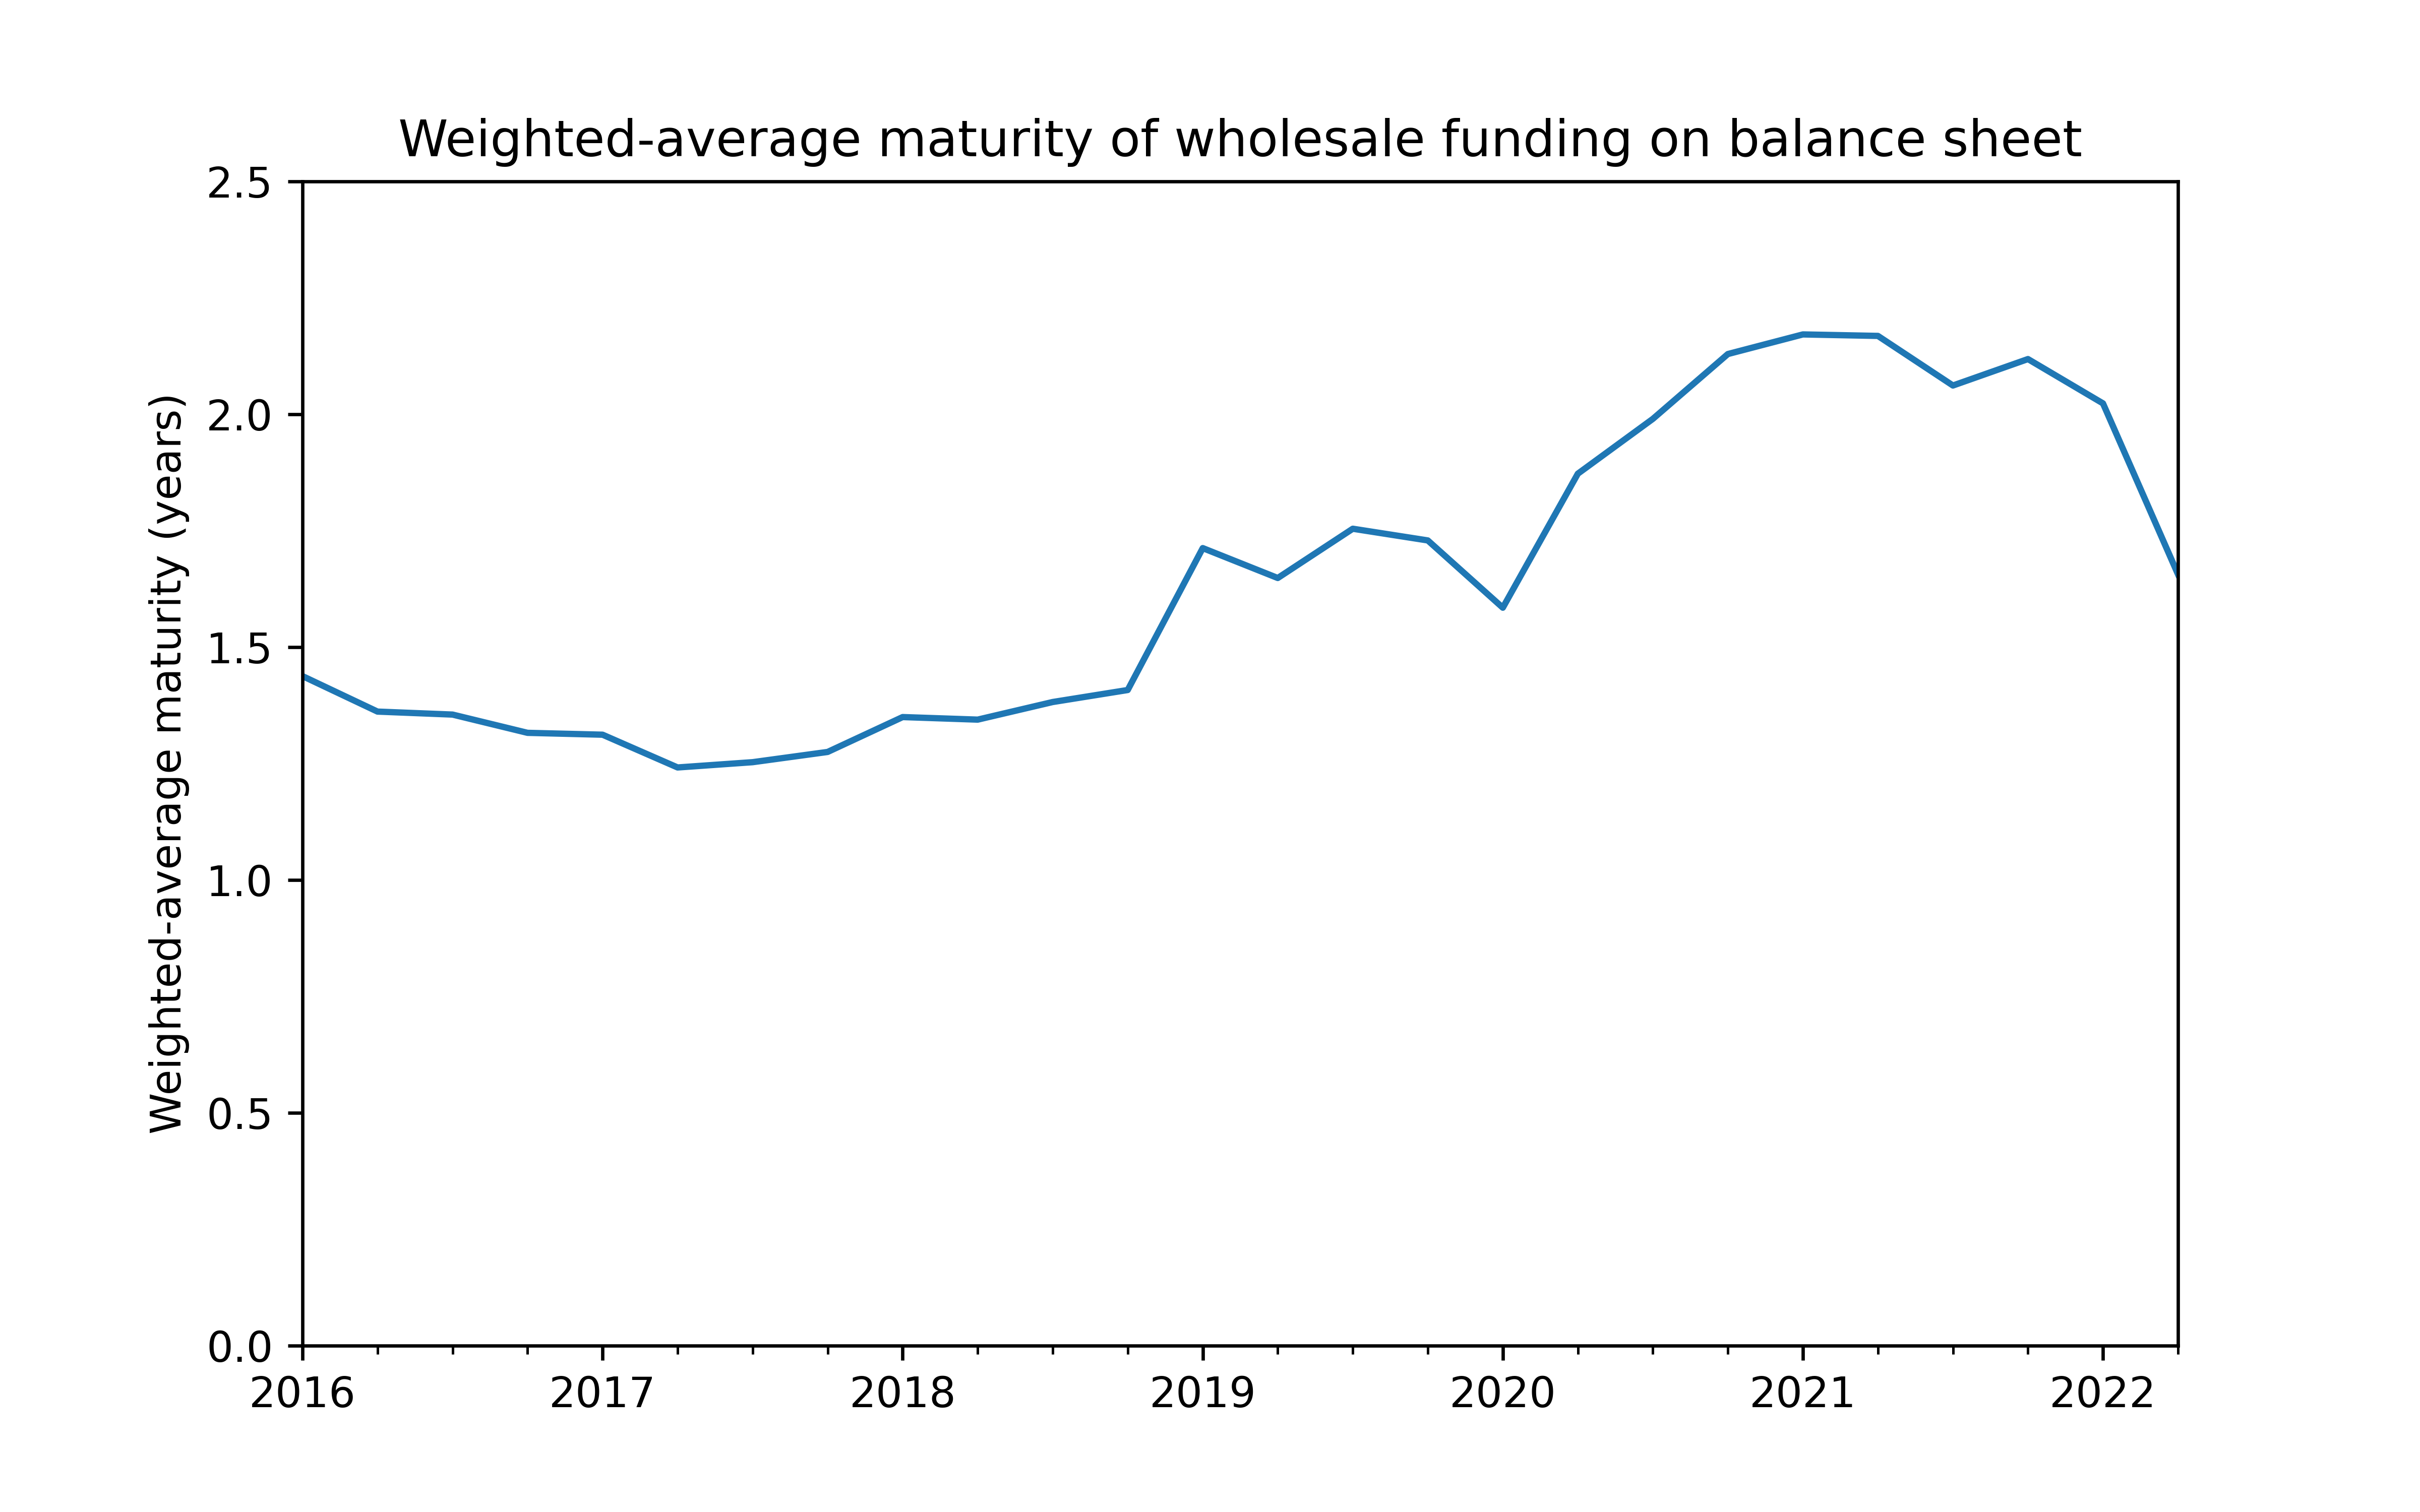
We can see these dynamics born out in the weighted-average maturity of funding on banks’ balance sheets, shown in the figure below [1]. Over the past six years, the weighted-average maturity of borrowed funding has been 1.6 years, as institutions purchase anywhere from overnight to 1 year to longer funds. One year ago, at the end of Q2 2021, the weighted-average maturity rose to 2.2 years, as banks purchased and locked in low-cost, long-term funding. However, as of Q2 2022, the weighted-average maturity has fallen back down to 1.7 years, a decrease of 24% compared to a year ago, as banks shy away from the more expensive long-term options and allow their longer-term funding to mature.
We expect the trend towards shorter-duration funding options to continue until there is more certainty around the future path of interest rates (which might take a while).
Best,
Paolo and the ModernFi Team
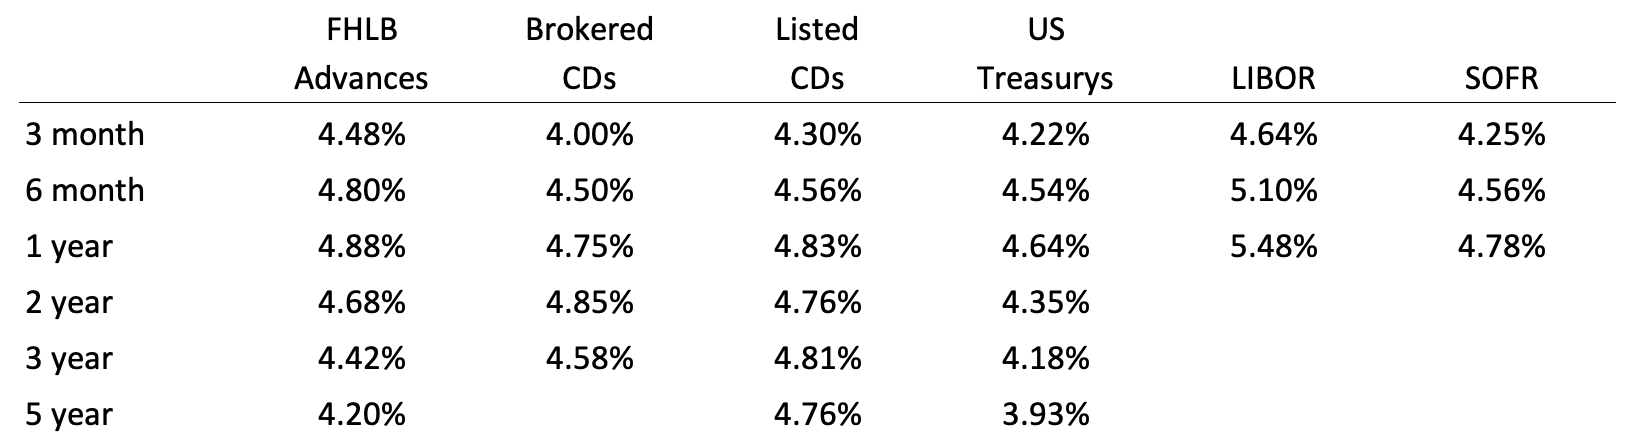
Current rates
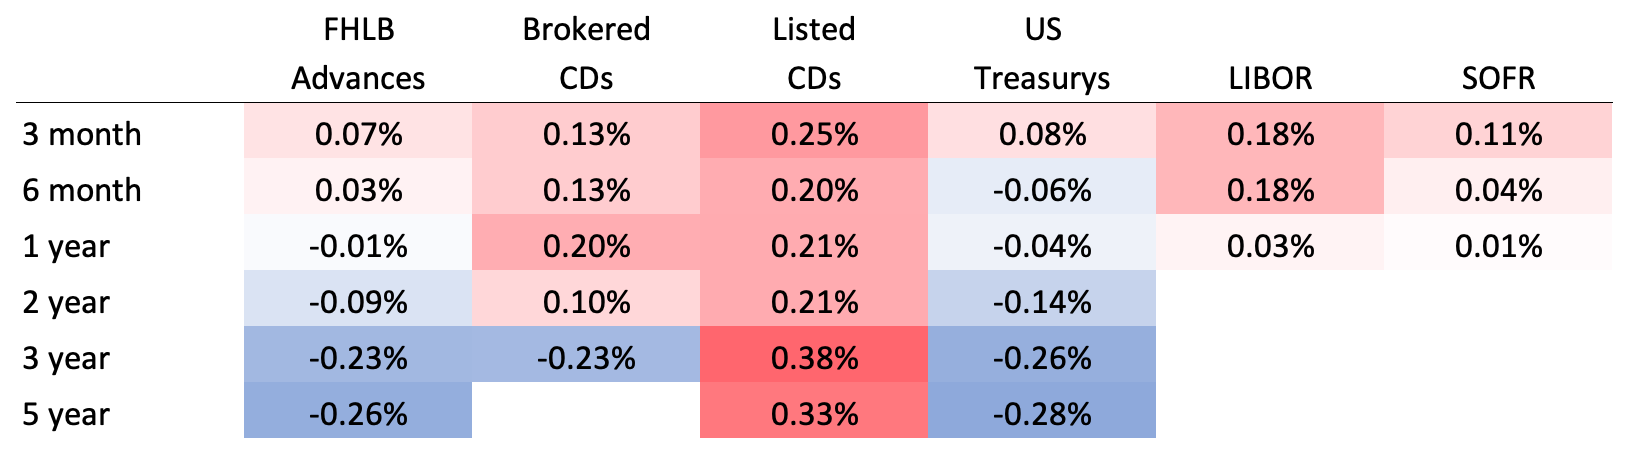
Change from two weeks ago
Sources: FHLB Advances are an average of FHLB Boston, FHLB Chicago, and FHLB Des Moines. Brokered CDs are an average of Fidelity and Vanguard. Listed CDs provided by National CD Rateline. US Treasurys and LIBOR provided by WSJ. SOFR provided by CME.
[1] Figure is constructed using data from the FDIC’s Statistics on Depository Institutions. Weighted-average maturity equals the sum of maturity multiplied by amount of funding of that maturity over the total amount of maturity funding, where the sum is taken over all maturities.
Disclosures:
All information contained herein is for informational purposes and should not be construed as investment advice. It does not constitute an offer, solicitation or recommendation to purchase any security, and is not intended to provide, and should not be relied on for, tax, legal or accounting advice. Past performance does not guarantee future results. The information contained herein is for institutional use only.
ModernFi Advisers LLC (ModernFi) is not a bank, nor does it offer bank deposits and its services are not guaranteed or insured by the FDIC; ModernFi allocates funds to banks that are FDIC members. ModernFi is an investment adviser registered with the United States Securities and Exchange Commission (SEC). For more information regarding the firm, please see its Form ADV on file with the SEC through the Investment Adviser Public Disclosure website. Registration with the SEC does not imply a particular level of skill or training.
Certain information contained herein has been obtained from third party sources and such information has not been independently verified by ModernFi. No representation, warranty, or undertaking, expressed or implied, is given to the accuracy or completeness of such information by ModernFi or any other person. While such sources are believed to be reliable, ModernFi does not assume any responsibility for the accuracy or completeness of such information. ModernFi does not undertake any obligation to update the information contained herein as of any future date.
Certain information contained herein constitutes “forward-looking statements,” which can be identified by the use of forward-looking terminology such as “may,” “will,” “should,” “expect,” “anticipate,” “project,” “estimate,” “intend,” “continue,” or “believe,” or the negatives thereof or other variations thereon or comparable terminology. Due to various risks and uncertainties, actual events, results or actual performance may differ materially from those reflected or contemplated in such forward-looking statements. Nothing contained herein may be relied upon as a guarantee, promise, assurance or a representation as to the future.
Except where otherwise indicated, the information contained in this communication is based on matters as they exist as of the date of preparation of such material and not as of the date of distribution or any future date. Recipients should not rely on this material in making any future investment decision.